Dashboard & KPI allow to quickly shape the best decision.
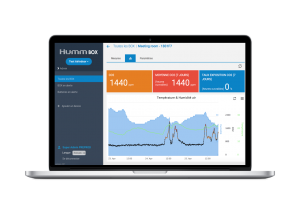
- Interactive charts with multiple series display (hide series…)
- Zoomable timeline charts
- DataViz
- KPIs are adapted to the solution and the use case:
For example
- Tank Monitoring: Autonomy prediction, Actual stock, Possible partial loading, …
- Air monitoring: CO2 average working hours, Over threshold CO2 percentage, Air temperature & moisture, …
- Vegetation monitoring: Soil temperature and moisture, Air temperature and humidity, Watering autonomy, CO2 (Greenhouse monitoring), …